 Phạm Ngọc Thái
Final determination of USDOC regarding to anti-dumping investigation of polyester textured yarn from Vietnam
 According
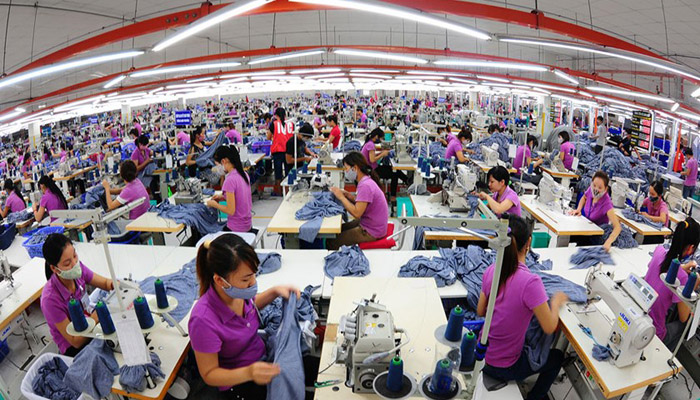
to the General Statistics Office of Vietnam, Vietnam made $ 13.18
billion in the first six months of the year thanks to exports of textile
and garment products. Meanwhile, data provided by the Bangladesh Export
Promotion Bureau shows that Bangladesh earned $ 11.92 billion from
exporting ready-to-wear products during the same period. However, both
countries suffered a decline in exports of this commodity because of the
pandemic.
Bangladeshi garment exporters explain to a Bangladeshi daily newspaper – that the Covid-19 pandemic has left them lagging behind Vietnam. Mohammad Hatem, Vice President of Bangladesh Knitwear Manufacturers and Exporters Association (BKMEA) told : “Bangladesh’s garment industry has plummeted during March, April and May due to activity. production and supply chain are interrupted by the ban being enforced to stop the spread of coronavirus ”.
“Vietnam’s production activities are not too disrupted because it has better control the spread of Covid-19” – Mr. Hatem said. Bangladesh, the second largest garment exporter after China, fell 20.14% to $ 2.25 billion in March and 85.25% to $ 375 million in April, the biggest drop in history. Exporter of this country. In May, apparel export earnings improved and stood at $ 1.23 billion but still suffered a 62% decline. In June, exports showed signs of recovery, to $ 2.24 billion.
http://textilefocus.com/vietnam-surpassed-bangladesh-garment-textile-exports-first-6-months-2020/
Nike could face shortage of “Made in Vietnam” sneakers as COVID-19 accelerates
Nike could face shortage of “Made in Vietnam” sneakers as COVID-19 accelerates
 |
| Nike is facing a potential shortage of sneakers made in Vietnam as suppliers are held up by COVID-19 |
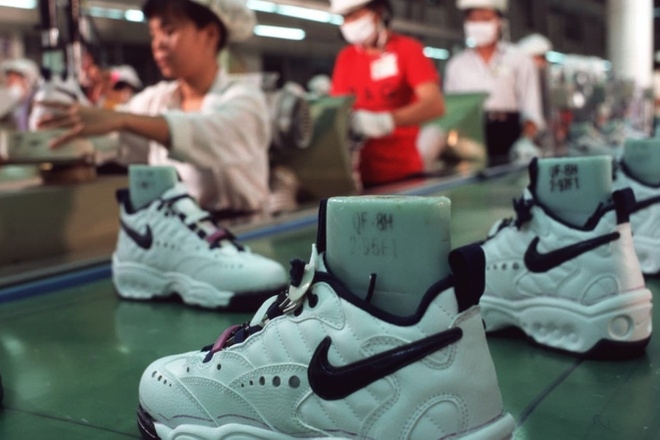
Two of Nike Inc.’s suppliers in Vietnam – Changshin Vietnam Co., Ltd. and Pou Chen Corporation – have temporarily suspended manufacturing to curb the spread of the coronavirus. This may exacerbate supply chain disruptions for Nike.
In the 2020 fiscal year, Nike said contract factories in Vietnam made roughly 50 per cent of its branded footwear. Meanwhile, global trade company Panjiva’s data shows that Vietnam accounted for 49 per cent of US seaborne imports linked to Nike and its products in the second quarter of 2021 after growth of 6.6 per cent on-year.
Nike’s imports from Vietnam are led by footwear, which was included in 82 per cent of shipments in the 12 months to June 30 after climbing 28.8 per cent in the second quarter of 2021 versus a year earlier. That raises the question as to whether other major sneaker brands may face similar challenges.
“The health and safety of our teammates, as well as that of our suppliers, remains our top priority,” a Nike spokeswoman told CNBC in an emailed statement.
“We continue to work with our suppliers to support their efforts in responding to the dynamic and unprecedented nature of COVID-19,” she said. “As we continue to navigate these circumstances, we expect our suppliers to prioritise the health and livelihoods of their employees and continue to comply with legal requirements and the Nike Code of Conduct on the provision of wages, benefits, and severance. We are confident in Nike’s ability to navigate these near-term dynamics and we remain prudent in our planning.”
Taiwanese foot manufacturer Pouyuen Vietnam suspended the operation of its factory in Ho Chi Minh City from July 14 to 23 as it can not arrange on-site camps and coronavirus testing every three days for all employees.
Pouyuen Vietnam is the largest employer in Ho Chi Minh City with over 56,000 employees. Cu Phat Nghiep, trade union chairman at the company, said that it is hard to prepare on-site camps for so many workers. The company also mulled about reducing production and headcount, however, even if the production is kept at a minimum of 30 per cent, the company would will have to provide accomodation for 16,000 workers.
Meanwhile, Changshin Vietnam, a South Korean shoemaker, also had to shut down three of its factories in the southern province of Dong Nai from July 15 to 20. The company, which employ nearly 42,000 workers, has detected a virus cluster at its factories.
By Thanh Van
EU carbon tax plan compels local suppliers to step up
EU carbon tax plan compels local suppliers to step up
 |
| EU carbon tax plan compels local suppliers to step up |
The European parliament earlier this month agreed to establish a resolution on the EU carbon border adjustment mechanism (CBAM), with the price mechanism scheduled to apply to certain goods imported from outside the EU, including Vietnam, if these countries are not ambitious enough in regards to climate change.
According to the plan, it would cover the power sector and energy-intensive industrial sectors like cement, steel, aluminium, oil refinery, paper, glass, chemicals, and fertilisers, and many others, which continue to receive substantial free allocations, and represent 94 per cent of EU industrial emissions. Members of the European Parliament stressed that it should be World Trade Organization compatible and not be misused as a tool to enhance protectionism. The plan aims to create global fair play and an incentive for both EU and non-EU industries to decarbonise in line with the objectives found in the Paris Agreement.
The draft mechanism on carbon price will be discussed in the coming months and is projected to come into effect from early 2023.
The EU is considered a strong market for goods from Vietnam since the EU-Vietnam Free Trade Agreement (EVFTA) came into effect in August last year.
Statistics published by the General Department of Vietnam Customs showed that in 2020, the total export turnover of goods from Vietnam to this market was $34.8 billion, a decrease of 2.3 per cent due to the COVID-19 pandemic. However, within the five months since the EVFTA took effect, the export value reached $15.38 billion, up 1.6 per cent on-year.
Vietnam’s group of agricultural and aquatic products such as seafood, rice, and coffee are considered commodities in which companies are quick to seize opportunities to boost exports to the EU market. The shipment of shrimp to the EU, for example, which accounts for 21 per cent of Vietnam’s total shrimp export turnover, was $30 million in the first month of this year, up 16 per cent on-year.
In addition, the EVFTA is expected to fuel the growth of Vietnam’s textile and garment industry by 6-14 per cent by 2030. The steel industry is also expected to be one of the beneficiaries when it is able to expand its export market to Europe.
Barrier to market penetration
However, entire sectors are causing a vast amount of greenhouse gas (GHG) emissions.
In the agricultural sector, estimates show that 45 per cent of total GHG emissions in the sector come from animal breeding. The main sources of such emissions from livestock are methane (25 per cent), CO2 from land use (32 per cent) and nitrous oxide from manure and sludge management (31 per cent).
Elsewhere, a survey by the Department of Energy Efficiency and Sustainable Development under the Vietnamese Ministry of Industry and Trade showed that in order to manufacture 10 million tonnes of steel, factories will emit 21 million tonnes of CO2.
The CO2 emissions in the industry are forecast to reach 122.5 million tonnes by 2025 and increase to 133 million tonnes by 2030, accounting for 17 per cent of the whole country’s total, with use of fossil fuels for production being deemed a major reason.
Experts agree that if manufacturers fail to switch towards greener manufacturing methods, they will lose opportunities to penetrate into the EU market.
Nevertheless, recently more companies in Vietnam have started to pay attention to carbon credits as well as GHGs, implementing specific strategies for reducing emissions.
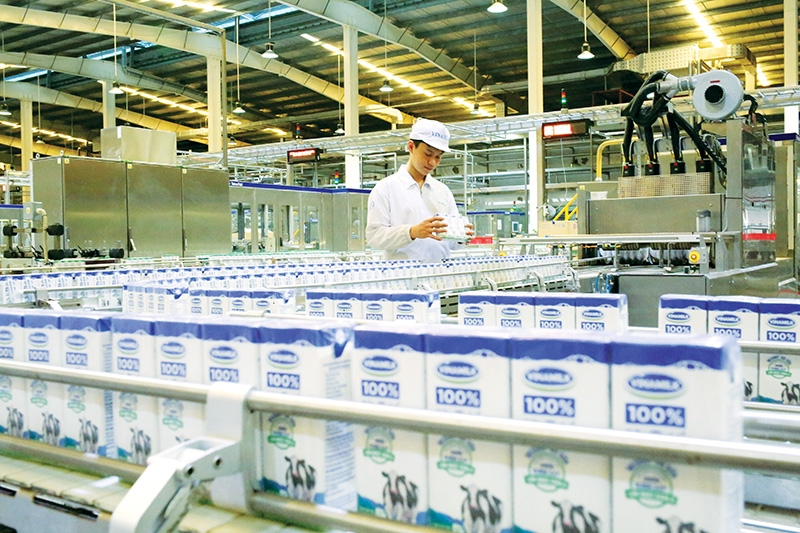
Vinamilk, whose products are exported to 53 countries and territories including the EU, is fulfilling a solar power system on 12 milk cow breeding farms. To date, five have installed a solar power system with the capacity of 19 million kWh, which will contribute to lowering over 17.3 million kg of CO2 per year. The figure is expected to increase to 62 million kg once the installation of the renewable system is completed. These emissions are equal to the ability of carbon to absorb 3.4 million trees.
Century Synthetic Fiber Corporation is also implementing a programme to decrease carbon emissions. The company measures its carbon footprint periodically to adjust solutions to decrease CO2 emissions, and has replaced trucks using gasoline with electronic vehicles.
According to its financial statement of 2019, the carbon footprint coefficient decreased by 6 per cent on-year, and the carbon footprint coefficient in terms of diesel in particular declined by 75 per cent on-year thanks to using electronic lift trucks. Century Synthetic Fiber is looking for more opportunities to export its products to the EU, thus, this preparation is helping the company realise its ambition.
Meanwhile, Vietnam National Cement Corporation (VICEM) and FLSmidth, a global leader in sustainable technology, are cooperating with each other to issue new solutions to significantly improve the sustainability of the cement sector in Vietnam. The goal is to implement technologies that radically reduce GHG emissions, pioneer solutions for using alternative fuels, and improve air quality.
The move is chance for VICEM to take advantage of sustainable technology to realise its target to reduce emissions of particulate matter, CO2, nitrogen oxide, and sulphur dioxide. Notably, while management of waste is a growing concern in Vietnam, FLSmidth is developing solutions that enable a 100 per cent switch to alternative fuels, which can reduce carbon emissions by about 33 per cent.
However, there are still very few enterprises that are aware of the importance of carbon emission decrease – and some that are aware are not exporters.
According to Dang Hong Hanh, co-founder and managing director of Energy and Environment Consultancy JSC (VNEEC), corporate attention on decreasing carbon emissions remains limited. The substantial parts of the transaction on the carbon credit market come from sellers, which sell carbon credits for manufacturers outside of Vietnam.
“A number of enterprises, which are outsourcing partners of global brands, started to apply solutions to decrease GHG emissions. However, in general a large part of enterprises lack proactive spirit. They just act when being urged, and numerous businesses implement solutions in a perfunctory manner,” Hanh said.
She said that once the carbon tax is implemented, it will indeed create challenges for manufacturers in Vietnam. Besides that, she believed Vietnam is not yet ambitious enough when it comes to its commitments to reducing GHG emissions. Vietnam also has yet to apply a carbon pricing policy, with the country not showing signs to apply a carbon tax in the domestic market before 2030.
Keeping pace with regulation
This is not first time that international requirements on carbon emission has been a barrier for Vietnam, with the garment and textile sector also suffering in this area. The US and European Parliament currently apply regulations on carbon labelling, requiring importers to meet the standard on carbon emission in the production process.
The Vietnamese government has been adjusting regulations to match with such international requirements. In November last year, the National Assembly adopted the revised Law on Environmental Protection, which contains a specific chapter on the implementation of Vietnam’s commitments and the responsibility for implementing the Paris Agreement’s commitments of Nationally Determined Contributions. From this year as a result, manufacturers with large carbon emissions must be held responsible and account for GHG schemes to reduce them.
According to Pham Van Tan, deputy director of the Department of Climate Change under the Ministry of Natural Resources and Environment, the declaration on such emissions is a compulsory requirement. “Vietnam will also update the National Strategy on Climate Change approved by the prime minister in 2011. From 2021 onward, Vietnam’s legal accountability on responding to climate change will be mentioned in the updated strategy,” Tan said.
Responding to the impact of the revised law on the business community’s awareness, Hanh told VIR that previously, VNEEC had to make efforts to persuade enterprises that the opportunity to earn money from carbon credits is real. At the time, almost all partners were still suspect of the feasibility of the opportunity.
However, since the revised law came into effect, VNEEC has received attention from numerous businesses that want to study their carbon footprint, the potential for the effort to lower GHG emissions, and opportunities from trading carbon credits.
“Although the cost for the solution to decrease emissions is quite high and it takes a long time to restructure, if businesses directly affected by the carbon tax can develop a strategy to reduce them as soon as possible, the emission intensity per unit can be gradually reduced, leading to lowering investment costs and tax payments later on,” Hanh said.
By Oanh Nguyen


